
Gemini 4 Argon has no single benchmark rank. Google’s launch table, the Artificial Analysis model record, and the FrontierSWE V2 leaderboard measure different tasks and report different kinds of evidence. The scores below stay in separate tables so a result on one evaluation is not presented as a win on all of them.
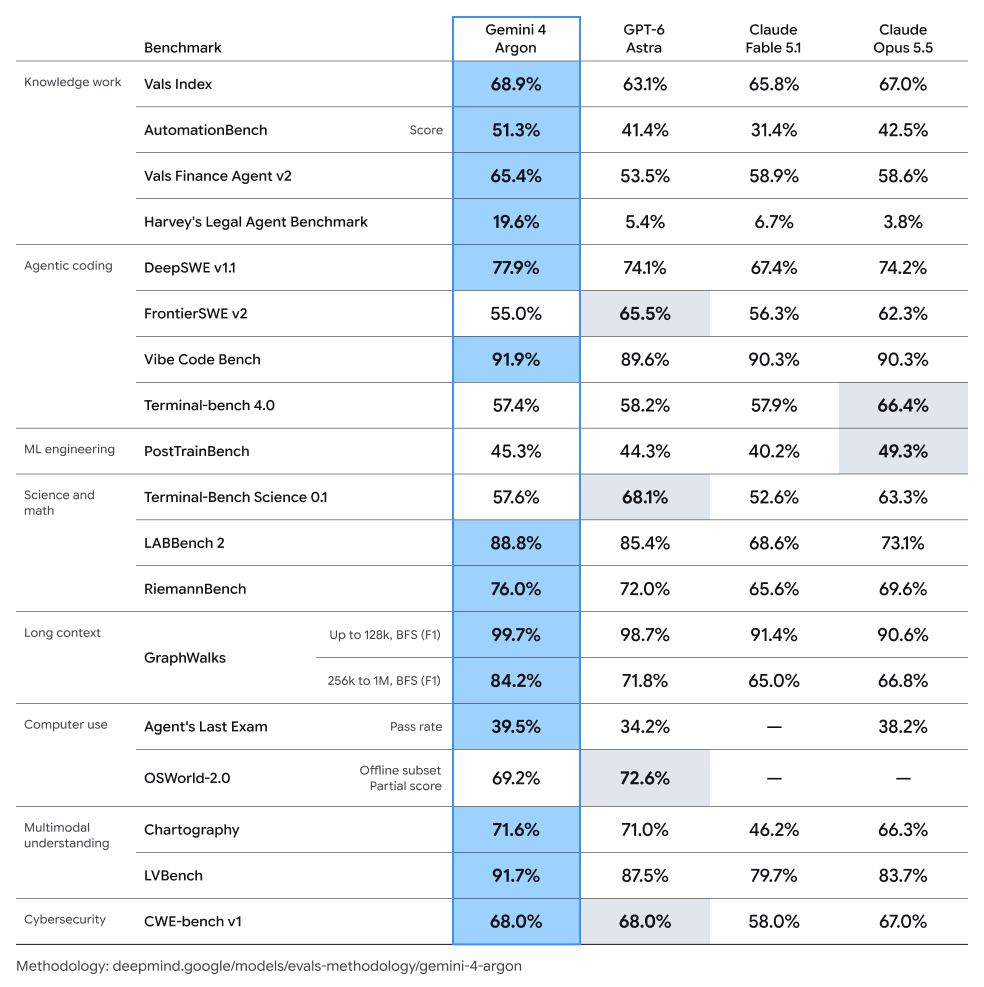
Source: Sundar Pichai, September 30, 2026. This is Google’s launch comparison table. Shaded cells are rows where another model leads. The methodology line printed on the image is deepmind.google/models/evals-methodology/gemini-4-argon.
Scores in Google’s September 30 table
The Google announcement highlights these scores:
| Evaluation | Argon score | Claim in Google’s post |
|---|---|---|
| DeepSWE v1.1 | 77.9% | New state of the art on long-horizon software engineering |
| AutomationBench (Zapier) | 51.3% | Ranked first on end-to-end business-task execution |
| LVBench | 91.7% | State of the art on long-video understanding |
| CWE-bench v1 | 68% | Tied for first on fixing security vulnerabilities |
The announcement article highlights those four rows. The posted table prints a wider set from the same launch. On that image, Vals Index is 68.9% for Argon and Harvey’s Legal Agent Benchmark is 19.6%. FrontierSWE v2 is 55.0% for Argon and 65.5% for Astra, with Astra’s cell shaded. Terminal-bench 4.0 is 57.4% for Argon and 66.4% for Opus 5.5, with Opus’s cell shaded. Those figures are read from the image above. They are not a second set of scores added on this page.
Artificial Analysis snapshot
The Artificial Analysis model record, checked October 5, 2026, reports a separate summary:
| Artificial Analysis field | Snapshot |
|---|---|
| Intelligence Index v4.3.2 | 53 (underlying 52.5606) |
| Cost per Intelligence Index task | About $1.99 |
| Context window | 1M tokens |
| Access flag | Not publicly available |
The Intelligence Index is a composite evaluation, so its rounded 53 should not be merged with Google’s task-specific percentages. The task-cost figure is an evaluation estimate, not a fixed customer charge. See API pricing and output limits for the token rates.
FrontierSWE V2: a primary coding leaderboard
The FrontierSWE V2 leaderboard reports a different coding result. Its headline table uses the proximus harness, all 34 tasks, five trials per task, and a 20-hour budget. Scores are mean@5; whiskers show worst@5 to best@5 and are not confidence intervals.
| Model | FrontierSWE V2 mean@5 |
|---|---|
| Gemini 4 Argon | 55.0% |
| GPT-6 Astra | 65.5% |
| Claude Opus 5.5 | 62.3% |
Under this setup, Astra is 10.5 percentage points above Argon. The same 55.0%, 65.5%, and 62.3% for Argon, Astra, and Opus 5.5 appear on the September 30 Google table above. FrontierSWE is not DeepSWE and is not Artificial Analysis Terminal-Bench 4.0, so this table does not rewrite Google’s DeepSWE result or establish a universal coding rank.
A third-party Text Arena chart
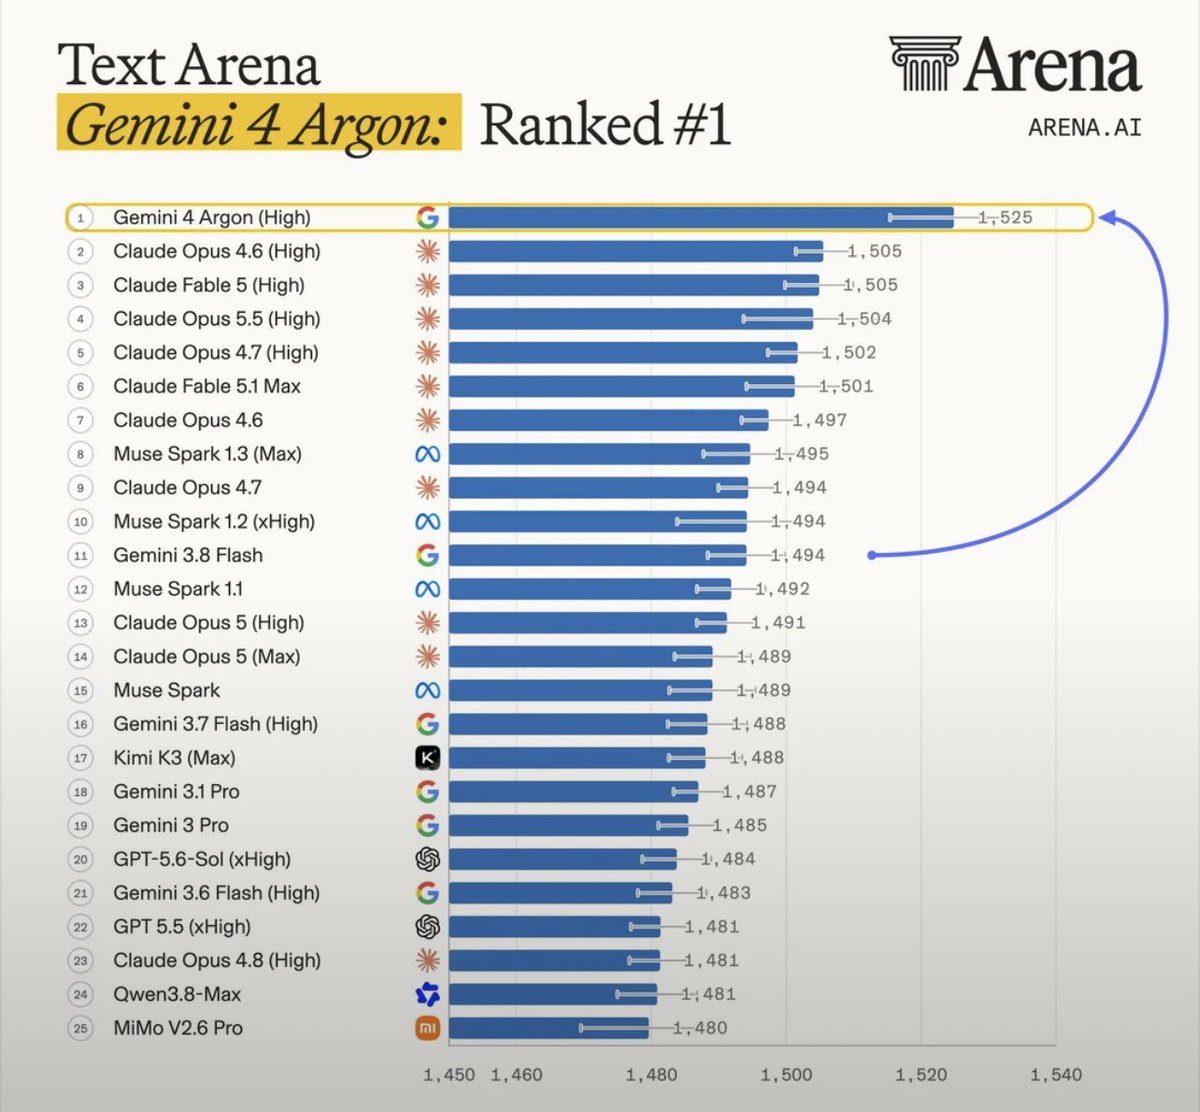
Source: @AI_Screening. This is that account’s chart, not an export from arena.ai, and it is not one of the three sources in the tables above. The chart labels Gemini 4 Argon (High) at Elo 1,525 and rank 1. The second bar is Claude Opus 4.6, not Opus 5.5. Read it as a preference-leaderboard image from that post.
How to read the spread
The useful conclusion is narrower than “Argon wins everything.” Argon’s reported result depends on the task, harness, model configuration, and scoring rule. For the separate 15.1% AA-Omniscience figure, read what the hallucination rate measures. For the difference between Argon and Gemma 4, see Gemma 4 versus Gemini.
Try Gemma 4 online
~/gemma4 $ Try Gemma 4 in the browser playground before setting up a local installation.
Open Gemma 4 playground />


